- GW0509
- Administrator
 Offline
- Registered: 7/22/2019
- Posts: 3,068
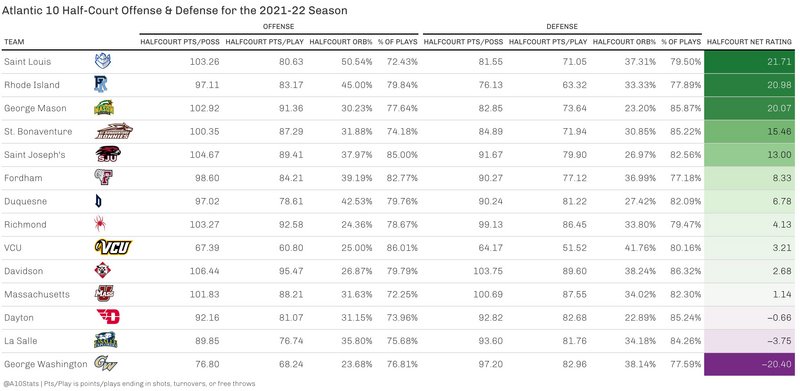
One Chart To Explain Our Crapitude
Look at our net rating in the half court. We are currently -20.40!!!!!!! which is 17 points worse than the 13th ranked team in the A-10. We are only scoring 76.80 points per possession while giving up 97.20 points in the half court. We are also grabbing only 23.68% of available offensive rebounds while our opponents grab 38.14% of theirs.
Fix this and maybe fix the season.
Last edited by GW0509 (11/19/2021 12:24 pm)
- BM
- Buff & Blue Club
 Offline
- From: Arlington, VA
- Registered: 7/22/2019
- Posts: 1,095
Re: One Chart To Explain Our Crapitude
Great chart from A10Stats (follow them here).
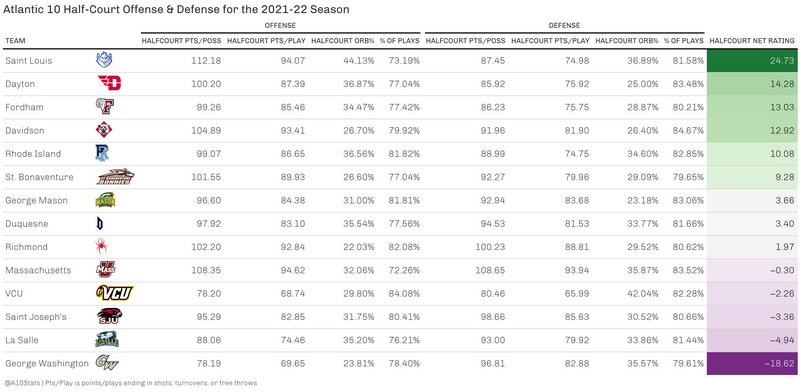
We're second to last in points generated from half-court offense and fourth to last in defending them. Hence the suck.
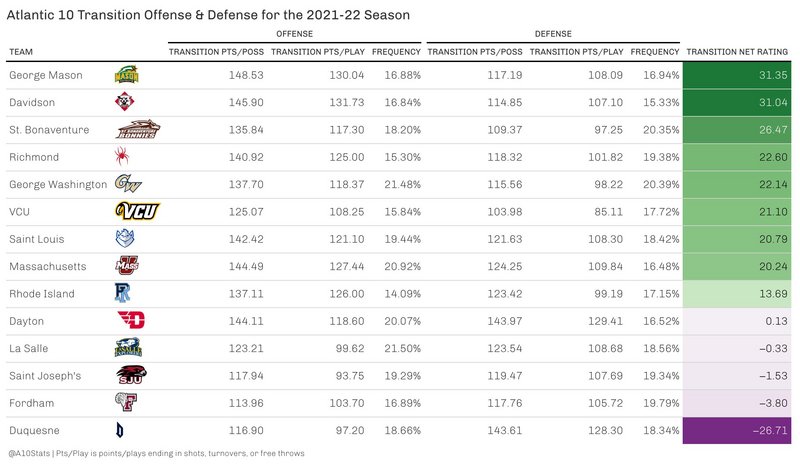
Better in full court:
Last edited by BM (11/19/2021 1:16 pm)
- jf
- Buff & Blue Club
 Offline
 - Registered: 11/14/2019
- Posts: 2,357
Re: One Chart To Explain Our Crapitude
Thought we were all about analytics.
Literally 4 young men with clipboards charting things during our California trip.
Couldn't have looked much more disjointed at least, if they were to don uniforms and and go in against mighty Cal St-Fullerton for awhile. Maybe they are used to teamwork.
- danjsport
- Buff & Blue Club
 Offline
 - Registered: 7/23/2019
- Posts: 286
Re: One Chart To Explain Our Crapitude
Interesting that we look like we run transition 2nd most on offense, but also other teams run transition on us the second most. So, we lose in the half court (considerably) and we are still letting teams break out on us. The smart money would be to slow it down, if you're GW's opponent.
- GW0509
- Administrator
 Offline
- Registered: 7/22/2019
- Posts: 3,068
Re: One Chart To Explain Our Crapitude
No surprise we are still very very bad in half court offense
Transition we are respectably in the Top 5
- •
- Free Quebec
- Buff & Blue Club
 Offline
 - Registered: 7/22/2019
- Posts: 2,196
Re: One Chart To Explain Our Crapitude
The worst part is, unless I’m mistaken, these are raw numbers - not adjusted for level of competition. So consider how inept our halfcourt offense has been and then realize, it’s not like we are playing UVA or Kansas, or even A10 teams. We’ve amassed these sad stats vs the BUs and UMASS-Lowell’s of the world.
- GW0509
- Administrator
 Offline
- Registered: 7/22/2019
- Posts: 3,068
Re: One Chart To Explain Our Crapitude
Free Quebec wrote:
The worst part is, unless I’m mistaken, these are raw numbers - not adjusted for level of competition. So consider how inept our halfcourt offense has been and then realize, it’s not like we are playing UVA or Kansas, or even A10 teams. We’ve amassed these sad stats vs the BUs and UMASS-Lowell’s of the world.
Good point. Yes, these are the raw uncut numbers we’ve put up against whatever the opposite of a murderer’s row is.
- •
- jf
- Buff & Blue Club
 Offline
 - Registered: 11/14/2019
- Posts: 2,357
Re: One Chart To Explain Our Crapitude
The worst part is also that we put so much focus into analytics. And here we are
Maybe try more eye test,since analytics not working out.
 1 of 1